In today’s commercial real estate market, sustainability is no longer an afterthought. With the growing tendency toward “flight to quality” among tenants — and amid concerns regarding the long-term prospects of office markets due to flexible working arrangements, downsizing and tightening credit — it’s not enough to use the latest smart materials and technologies to convince tenants of your project’s eco-credentials. That’s because prospective clients will also be looking beyond their office windows at their immediate surroundings — whether that’s the city’s commitment to reducing CO2 emissions, plans to build electric vehicle infrastructure or the stringency of local building policies.
With that in mind, we set out to rank the most eco-friendly office markets within the U.S. according to eight metrics that analyze each location’s sustainability performances, both in terms of the building itself (certifications, energy efficiency and materials used), as well as the environment in which the green office is located (building policies, EV charging stations, public transit and walkability). For a more detailed view of the indicators used in this ranking, as well as the points allocated to each one, please consult our methodology.
Keep reading to find out more about the top 10 nationwide, as well as see a region-by-region breakdown of the most eco-friendly office markets in the U.S.
DC in Pole Position Among the Most Eco-Friendly U.S. Office Markets
A quick look at the top 10 reveals that nearly half of the list is made up of Western office markets. Dominant display notwithstanding, the highest-ranking among them came second to a Southern entry as Washington, D.C. topped the list of eco-friendly office markets.
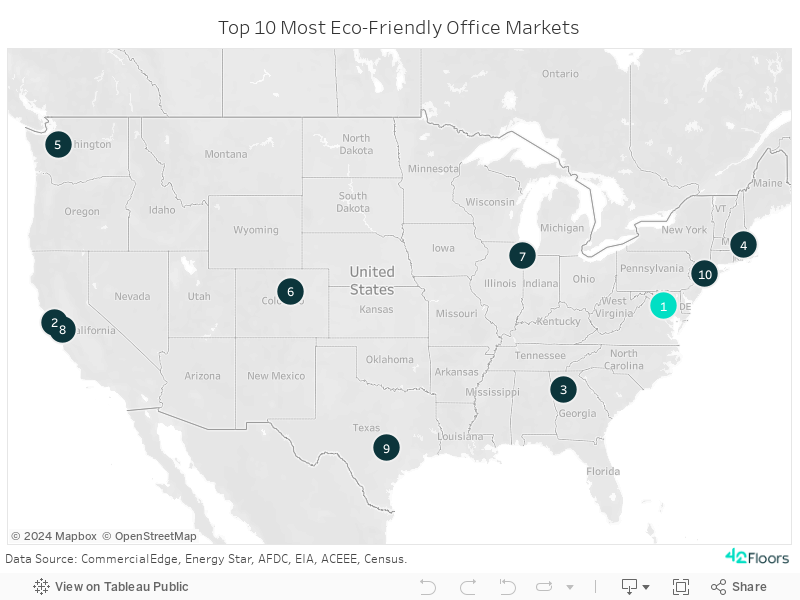
More precisely, the city scored a total of 71 points and the highest ratio of energy-efficient buildings with 90.4 square feet of Energy Star-graded properties per capita. The nation’s capital also had the third-highest LEED score on our list, just behind San Francisco and Chicago. That translated to roughly 40% of office spaces in Washington, D.C. being certified LEED Gold, while 12.4% of the inventory was comprised of buildings that had been awarded the highest rating in class (Platinum).
In second place, San Francisco picked up a significant share of its total score for its top performance across the LEED score metric. Here, nearly one-quarter of the properties that make up the San Francisco office market were certified LEED Platinum — the highest percentage for this classification across the ranking.
Meanwhile, Atlanta — home to the highest number of EV charging stations per 100,000 residents by a considerable distance — also outranked other entries on our list for its percentage of buildings with an alternative façade, as nearly one-quarter of office properties in the city had a wood or glass exterior. Overall, Atlanta totaled 65.68 points, which placed it third among the top eco-friendly office markets.
Next, Boston obtained the second-best score for its EV-charging-station ratio and percentage of people commuting using public transit or non-motorized vehicles. In addition, the city also collected important points for placing fourth for its share of LEED-certified office buildings in its inventory, as well as the square footage of energy-efficient office space per capita.
Ranking sixth overall with a total of 50.94 points, Denver topped the ACEEE building policies score indicator, which gauges advancements made in the reduction of energy waste and workplace equity. More precisely, Denver accrued the maximum points for this metric, outranking the likes of New York and Seattle.
It’s worth noting that all three cities have strict building energy codes in place, such as the Green Building Ordinance, which requires all Denver office spaces or any property or addition of more than 25,000 square feet to meet performance standards and benchmark energy use. Moreover, there are also multiple requirements to improve the energy efficiency in existing buildings.
In seventh place, Chicago had the second-highest LEED score in the top 10, while also picking up precious points for its performances on the ACEEE building policies scorecard.
Notably, California was the only state to feature two entries in the top 10 most eco-friendly office markets in the U.S. In this case, Oakland occupied eighth place with a total of 45 points. The city boasted the lowest CO2 emissions and had the second-highest increase in LEED-certified office properties between 2018 and 2022.
Similarly, although it ranked ninth overall, Austin, clinched first place for its LEED-certified office space growth: The city’s green office inventory grew by 5% between 2018 and 2022.
New York closed out the top 10 with an unsurprising first spot for its green commuting. Here, roughly half of the city’s residents travel to work by foot, bike or public transportation options.
Eco-Friendly Office Markets: Regional Top 5 Rankings
Northeast: Boston Outranks NYC in Energy-Efficient Square Footage Per Capita Among Northeastern Markets
Boston ranked first among eco-friendly office markets in the Northeast with an unrivaled performance in terms of its per capita share of Energy Star-graded buildings. Specifically, at 53 square feet per capita, Boston’s market ratio for energy-efficient office assets was more than quadruple that of its contenders.
And, although it ranked fourth nationally for its share of LEED-certified office buildings, Boston dominated this indicator on this regional shortlist: According to the latest CommercialEdge data, roughly 43% of office spaces in Boston had a LEED Gold certification, as compared to 29% in second-placed New York. The Massachusetts capital also had a higher percentage of office properties graded LEED Platinum at 12%, versus New York’s 5%.
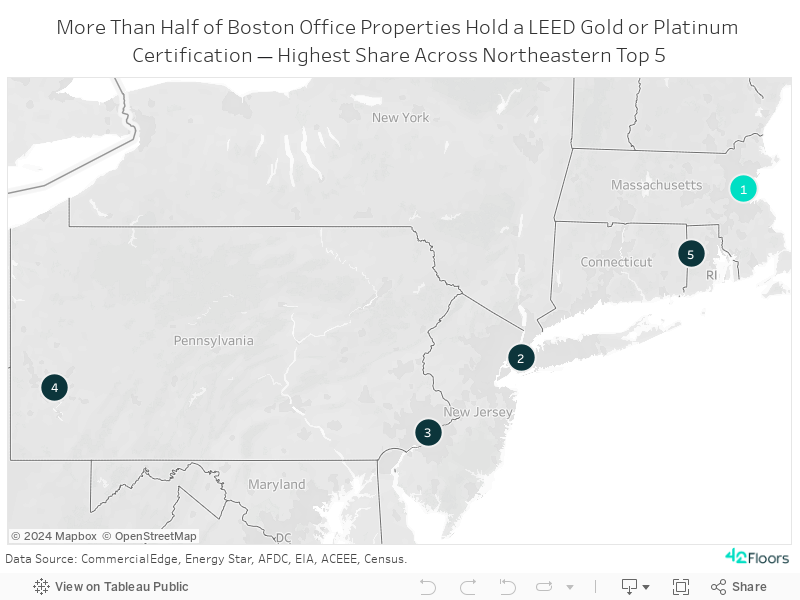
Meanwhile, nearly half of New Yorkers commute by public transit, on foot or via non-motorized vehicles, such as bikes. The New York office market also boasted the highest share of properties built with wood or glass exteriors out of its total inventory (19%). However, most of its points came as a result of its placement on the ACEEE Building Policies Scorecard, where it managed to outmuscle Boston for the number one spot.
Interestingly, Philadelphia secured its spot in the regional ranking through a series of third-place finishes across multiple indicators. For instance, it ranked third for its percentage of LEED-certified properties added to the Philadelphia office market between 2018 and 2022, as well as for the ACEEE Building Policies scores obtained by offices in the city’s inventory.
Staying in Pennsylvania, Pittsburgh boasted 61 EV charging stations per 100,000 residents — the second-highest ratio in the Northeast top five and only slightly behind Boston. Plus, the city has announced plans to invest further in developing its electric car infrastructure by achieving a no more than 50-mile gap between stations on interstate highways. Pittsburgh was also a distant second to Boston in terms of its energy-efficient office square footage per capita.
Providence, R.I., closed out the Northeastern top five, garnering top points for its jump in the percentage of its LEED-certified building inventory during the last five years.
West: 63%+ of San Francisco Office Buildings Hold LEED Platinum or Gold Certification
Among Western eco-friendly office markets, San Francisco stood out for accruing the highest LEED score and most Energy Star square footage per capita: According to CommercialEdge data, roughly 25% of office buildings in San Francisco boasted the highest LEED certification (Platinum) — the greatest share not only in the West, but also across all regional top five rankings. Additionally, approximately 39% of assets in San Francisco’s inventory were LEED Gold certified.
Next, with 51 charging stations per 100,000 residents — the highest ratio across the regional top five — Seattle positioned itself as one of the most electric-car-friendly places in the U.S. What’s more, Seattle residents are also keener to walk, cycle or choose a public transit option for their commute than working-age people living in the other top Western cities. The city also came in second for its LEED score and energy efficiency within the region.
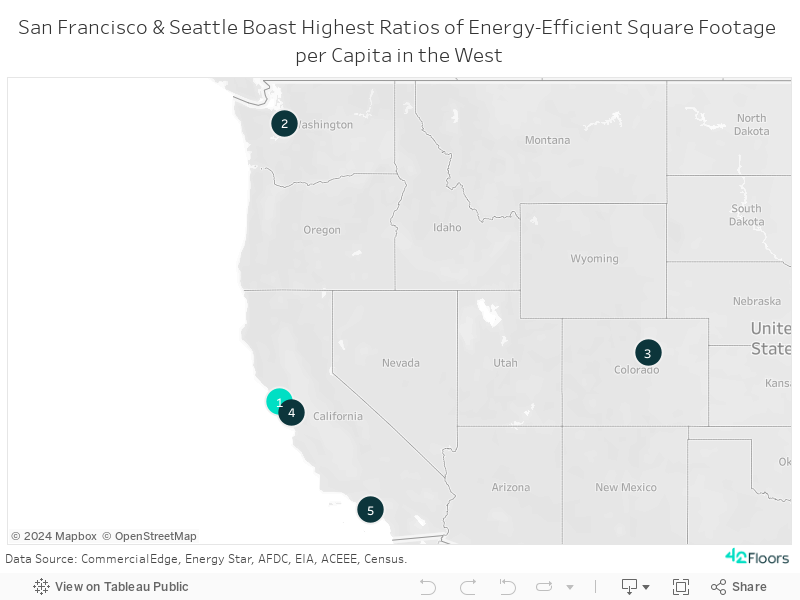
Further east, Denver’s leading metric was its performance on the ACEEE Building Policies Scorecard, while Oakland, Calif., landed in third place for its percentage share of LEED-certified office buildings: Approximately 11% of office space in Oakland was labeled as LEED Platinum and another 25% was classified as Gold.
Still in California, Long Beach stood out for its widespread use of wood and glass for its office property exteriors (22%), as well as its ratio of EV charging stations per 100,000 residents.
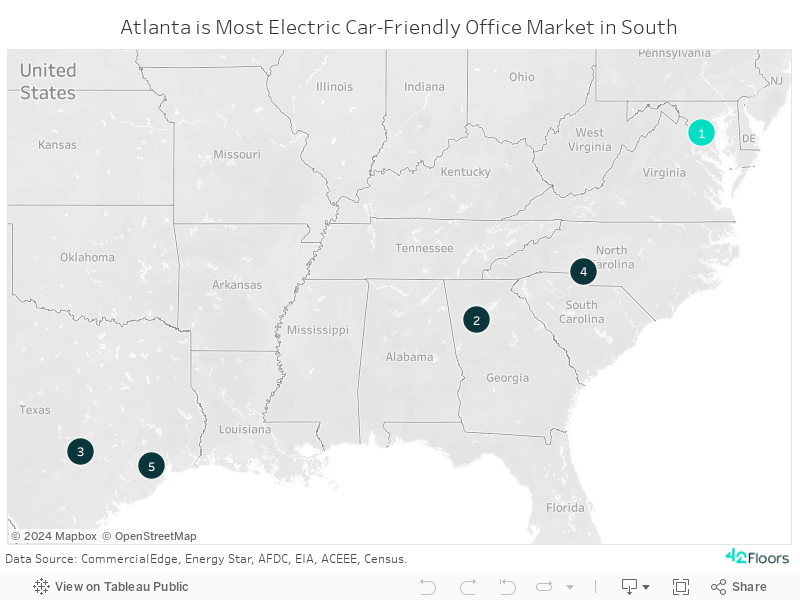
20% of Washington, D.C. Residents Walk, Ride or Use Public Transportation to Commute — the Highest Share Among Top Southern Markets
Washington, D.C. led the regional top five for the most eco-friendly office markets in the South. Namely, its top placement for its green commuting percentages, as well as its Energy Star square footage per capita, were major contributors to its score.
Meanwhile, thanks to a ratio of 109 EV charging stations per 100,000 residents, Atlanta topped this metric both at the national and regional level.
And, although Austin had one of the lowest percentages of LEED-certified office spaces in its inventory, it also recorded the largest increase in this category in the last five years.
In addition to the three entries that also made the nationwide list of eco-friendly office markets, the region’s top five was rounded out by Charlotte, N.C., and Houston:
Charlotte came in second for the highest-percentage increase of LEED-certified buildings between 2018 and 2022. At 4%, the market ranked just below Austin, which was the frontrunner for this metric. Charlotte also came in third in terms of its LEED score, in addition to boasting the second-lowest CO2 emissions across the Southern top five.
Not to be outdone, Houston was a close second to Atlanta for its total share of office buildings with a glass or wood façade. Currently, 24% of Houston’s office inventory contains properties built out of such materials.
Midwest: Minneapolis Boasts Nearly Double the Amount of Energy-Star-Certified Buildings as Chicago
Back in the Midwest, Chicago received the highest LEED score among the top five Midwestern eco-friendly markets (18.39 points), accruing more than double the number of points as its runner-up, Minneapolis. To date, more than 37% of Chicago’s inventory is comprised of LEED Gold-certified office buildings, with an additional 19% having received the highest Platinum LEED certification. At the regional level, the city also came in first for the percentage of its residents who opt for green commuting options (18.6%).
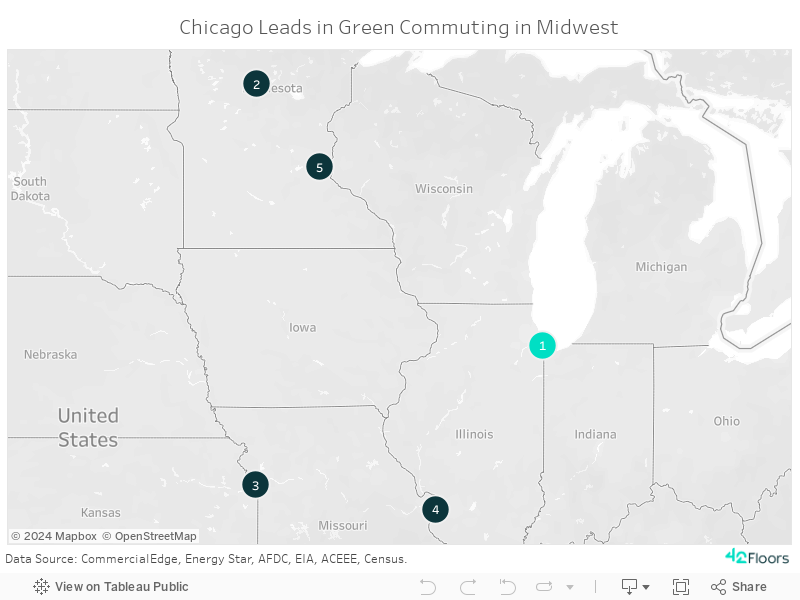
Not far behind, Minneapolis had the largest square footage of energy-efficient office space per capita among Midwestern markets, and double that of Chicago. It also recorded the best performance across the ACEEE Building Policies Scorecard in this list.
Finally, Kansas City, Mo., already had one of the best ratios of EV charging station per 100,000 residents outside of the West Coast. Even so, there are plans in place to further boost federal funding to expand the infrastructure.
Methodology
We ranked the most eco-friendly office markets in the U.S. based on eight select indicators. Each city could score between zero and maximum points for each metric, which was directly proportional to its performance in the respective index.
Exception: CO2 emissions (MMT) — points were allotted inversely proportional (the lower the emissions, the more points awarded)
The study excluded cities with fewer than 150,000 residents, as well as entries that had fewer than five LEED buildings.
*LEED (Leadership in Energy and Environmental Design) certifications are awarded by the U.S. Green Building Council (USBGC). Points are awarded based on the types of materials used for construction, water and energy efficiency; the effect on the health of residents, etc.
“LEED Score” is a compound metric that shows the cumulated score for the following:
- Percentage share of LEED Platinum-certified square footage out of total inventory for properties larger than 25,000 square feet with a primary use type of office and completed by December 31, 2022. Data sourced from CommercialEdge. The maximum weight for this metric was 12 points.
- Percentage share of LEED Gold-certified square footage out of total inventory for properties larger than 25,000 square feet with a primary use type of office and completed by December 31, 2022. Data sourced from CommercialEdge. The maximum weight for this metric was 7 points.
- Percentage share of LEED Silver-certified square footage out of total inventory for properties larger than 25,000 square feet with a primary use type of office and completed by December 31, 2022. Data sourced from CommercialEdge. The maximum weight for this metric was 4 points.
- Percentage share of LEED certified square footage out of total inventory for properties larger than 25,000 square feet with a primary use type of office and completed by December 31, 2022. Data sourced from CommercialEdge. The maximum weight for this metric was 2 points.
The maximum weight for this compound metric was 25 points.
“LEED 2018 vs. 2022” shows the percentage point difference between the total LEED-certified square footage out of total inventory between 2018 and 2022. Data sourced from CommercialEdge. The maximum weight for this metric was 15 points.
“Energy Star Square Feet per Capita” represents the square footage of 2022 Energy Star* certified buildings per city capita. In this metric, we included only properties that received the Energy Star certification during the course of 2022 and that had one of the following property types: office, financial office or medical office. Data sourced from EnergyStar. The maximum weight for this metric was 25 points.
*Energy Star is a certification of energy efficiency within a building.
“ACEEE Building Policies Scorecard” refers to the building policies section contained within the ACEEE’s City Clean Energy Scorecard. It provides a comprehensive national measuring stick for climate progress in cities — from the leaders to those with ample room for progress.
The scorecard allocates points to U.S. cities based on:
- building energy code adoption
- code compliance and enforcement for new and existing buildings
- equity in existing buildings
- workforce development
The maximum weight for this metric was 15 points.
“% Alternative Façade” represents the ratio of office square footage with a glass or wood exterior out of the total inventory. For this metric, we used properties larger than 25,000 square feet with a primary use type of office and completed by December 31, 2022. Data sourced from CommercialEdge. The maximum weight for this metric was 5 points.
“Green Commuting” is defined as the percentage of a city’s working-age population (16 years and older) who use green means of transportation for their daily commute — public transit (excluding taxicab), walking and cycling. Data sourced from U.S. Census Bureau. The maximum weight for this metric was 5 points.
“EV Charging Stations” represents the number of electric vehicle charging stations per 100,000 residents. Data sourced from Alternative Fuels Data Center (AFDC). The maximum weight for this metric was 5 points.
“Commercial CO2 Emissions (MMT)” shows the CO2 emissions within the commercial sector, displayed in million metric tons. Because data is only available at the state level for this indicator, we divided each entry’s commercial CO2 emissions by the state’s total commercial real estate square footage and then multiplied that by the city’s total square footage. The maximum weight for this metric was 5 points.