Which U.S. cities are the loudest? Chances are, the first contender that came to mind was New York City, but plenty of urban centers across the country are struggling with increasing levels of noise pollution. And, while scientists and activists have been aware of this idea since the early 1900s, finding comprehensive solutions to reduce noise pollution requires a multifaceted approach.
First, any measures to address this issue would need to identify the worst offenders in the context of each city. To this end, 42Floors proposes a two-part study that seeks to rank the noisiest large and mid-sized U.S. cities. Specifically, we ranked entries based on their performances across 12 metrics, including: the number of annual operations at airports servicing a city; the amount of construction activity in the last five years, as well as the current development pipeline; population density; and the percentage of residents using motorized vehicles for their daily commute.
Secondly, while some noises might be unpleasant or unwanted, cities need things like construction, transportation and an active social scene to thrive and ultimately meet the needs of their residents. We’ve addressed some of the nuances of this topic in our conclusions section.
Keep reading to find out which U.S. cities made the list (as well as how loud they are compared to New York City).
For more information regarding all of the indicators used in our ranking and how they were weighted, as well as details about which cities where included, please refer to our methodology section.
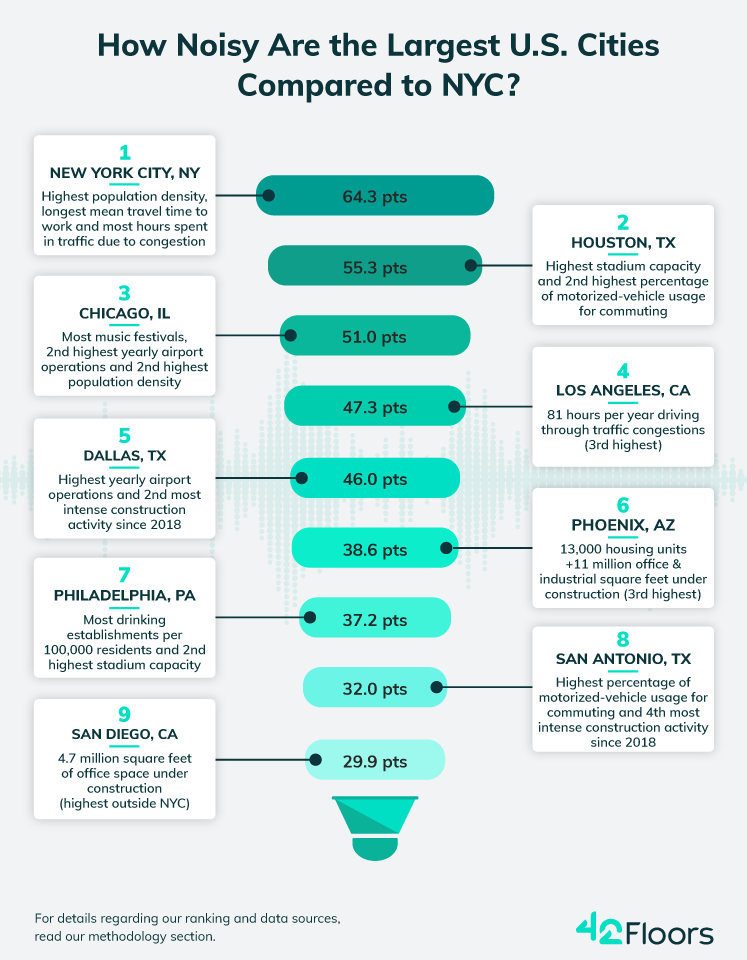
New York City, NY
 Given New York City’s reputation for being loud — and proudly so — it’s befitting that the seeds of the first anti-noise movement were planted here with the funding of the Society for the Suppression of Unnecessary Noise back in 1903.
And, with around 8 million inhabitants packed into its five boroughs, the city also boasts the highest population density (28,182 people per square mile) — more than double that of runner-up Chicago.
Naturally, the need to house and enable so many people to move around and conduct their daily activities relies on noise-generating activities, such as transportation and construction work. To that end, although more people walk or used non-motorized modes of transportation to get around here than in any other city in our ranking, residents still lose precious hours each year due to congestion. And, by sludging through the busy streets, they both endure and generate noise in the process. In fact, New Yorkers spend the equivalent of almost an extra day and a half in traffic compared to those living in Chicago or Los Angeles. Accordingly, mean commute times are also higher in the Big Apple than in any other city, averaging roughly 40 minutes one-way.
What’s more, most of the city’s extensive construction activity in the last five years has also been focused on high-density office and multifamily buildings with New York earning the first- and second-highest numbers in terms of office and industrial development, respectively. As such, construction crane activity is unlikely to slow down, with some 17 million square feet of office space and an additional 26,404 residential projects still in the pipeline.
Houston, TX

Major urban centers in Texas are notoriously car-dependent, and Houston stood out with 82% motor-vehicle usage by its residents — the second-highest value for this metric within the ranking.
Home to several high-capacity stadiums and indoor arenas — such as the NRG Stadium and Rice Stadium — Houston is no stranger to events that can drive up the decibels. And, with Minute Maid Park (home of the Astros) and Toyota Center (home of the Rockets) located in downtown, game days are bound to be loud with several tens of thousands of people seated within each of these venues.
Furthermore, there were also 15.9 drinking establishments per 100,000 residents in Houston, making it the third-highest-ranking entry for this indicator, behind only Philadelphia and Chicago. In particular, Washington Avenue is one of the hot spots for noise complaints across the city, according to recent Houston Police Department data.
By issuing noise permits for events above a certain decibel level, local authorities have tried to mitigate the issue. That said, they also have to take into account the needs of an ever-growing city, where the bars and clubs that render Houston’s nightlife as enticing are sometimes just a few feet away from people’s homes.
Additionally, manufacturing and industrial activities are also an important source of sound and environmental pollution. And, with Houston recording the highest share of industrial square foot per capita on the list, it’s clear that the city’s soundscape is anything but subdued.
Chicago, IL

As the most densely populated city outside of New York, life in the Windy City can get rather hectic with the 11,841 people per square mile that Chicago has to accommodate. Add to that the more than 1 million yearly landings and take-offs happening at airports serving the city (the second-highest for this indicator) and Chicago’s noise map becomes increasingly complex.
However, with so many people flying in, it’s clear that the city has a lot to offer. Namely, music is big in Chicago, with the latest beats and songs flowing across the city’s neighborhoods, downtown parks and along the lakefront. While Lollapalooza and the Chicago Blues Festival are the most well-known music festivals, the city boasts no fewer than 11 such events — the highest number among large U.S. cities.
The city was also second only to New York for the number of hours spent by its residents in traffic due to congestion. According to data gathered by TomTom, the average Chicagoan wastes 82 hours each year stuck in a car or on public transportation putting up with the phonic discomfort associated with traffic. That fact was also reflected in the relatively long mean commute time in Chicago (roughly 32.3 minutes), which was just seven minutes short of New York’s average.
Los Angeles, CA

Despite the unflattering reputation of traffic in Los Angeles, 73% of its residents use a motorized vehicle for their drive into work. As a result, the city ranked fifth for this metric among large cities.
Nevertheless, Angelinos still spend an extra 81 hours per year driving through traffic congestion, with the mean travel time to work hovering around 29.8 minutes.
The long list of music festivals hosted by Los Angeles also comes with an inevitable spike in noise levels, as large groups of locals and visitors partake in the city’s social life. Raucous tourists notwithstanding, Los Angeles also had the fourth-highest urban density among U.S. cities with 8,199 residents per square mile (behind New York, Chicago and Philadelphia).
Dallas, TX

When American Airlines moved its headquarters from New York City to Dallas in 1979, it marked a key moment in the Texas city’s role in U.S. aviation. Since then, Dallas has been home to the most active airports in the country with roughly 1.1 million yearly landings and take-offs.
Moreover, traffic in the sky is matched by traffic on the ground as 79% of the city’s residents drive or ride motorcycles into work — the third-noisiest commute percentage across cities with more than 1 million people.
Plus, the growing crane count at various sites across Dallas is also indicative of the city becoming a darling of the tech and startup scene and of the buzz (both literal and metaphorical) that such a status brings. As a matter of fact, the city had the second-highest amount of industrial square footage per capita and there were 29,417 housing units, as well as 23 million square feet of industrial and office space, delivered to the market between 2018 and 2022.
Phoenix, AZ

Phoenix’s soundscape is marked by similar noise sources as that of Dallas, with intense commercial development in the last five years resulting in the third-highest density of industrial square footage per capita. What’s more, residents of the Arizona city will have to contend with the sounds of active construction sites in future years, as well, because Phoenix has nearly 11 million square feet of industrial space in the pipeline.
Home to the third-busiest aviation hubs in our ranking with 948,340 annual landings and take-offs, Phoenix also had the fourth-highest percentage of commuters traveling to work via a motorized vehicle (76%). And, while the streets of Arizona’s capital are by no means quiet (especially during peak congestion hours), Phoenicians might be glad to learn that they spend far less time on their commute to work and fewer hours per year stuck in traffic, on average, than the other cities on our list.
Philadelphia, PA

With 11,732 residents per square mile, Philadelphia had the third-highest urban density in our ranking, as well as the highest ratio of drinking establishments per 100,000 residents among entries.
Home to high-volume sports and indoor arenas — such as Lincoln Financial Field, Franklin Field and Citizens Bank Park — Philadelphia trailed only Houston for its capacity to hold the greatest (and loudest) events.
Additionally, with their average travel time to work just above the 30-minute mark, Philadelphians endure the third-longest commutes among cities with populations exceeding 1 million residents.
San Antonio, TX

Notably, San Antonio had the lowest percentage of people working from home (15%), so an important share of its workforce makes regular trips to work. And, while some might be lucky enough to live close to work or commute by means that generate little noise, 83% of residents here use motorized vehicles for their commute — the highest value for this metric on the list.
Without a doubt, industrial development has been a significant source of noise for those living in San Antonio during the last five years as the city witnessed the third-most intense construction activity in this sector among entries. Specifically, between 2018 and 2022, the local pipeline churned out roughly 12.4 million square feet of new industrial space.
San Diego, CA

Outside of New York City, San Diego boasts the most substantial office pipeline on our list with nearly 4.7 million square feet of new space to be added to its inventory. However, across all other metrics, residents have a lot less to worry about in terms of noise pollution as the city had the third-lowest number of airport landings and take-offs per year.
Meanwhile, the city also claimed the second-highest number of people working from home, which contributed to its relatively low average commute time (22.4 minutes), as well as its low number of annual hours spent in traffic (25 hours).
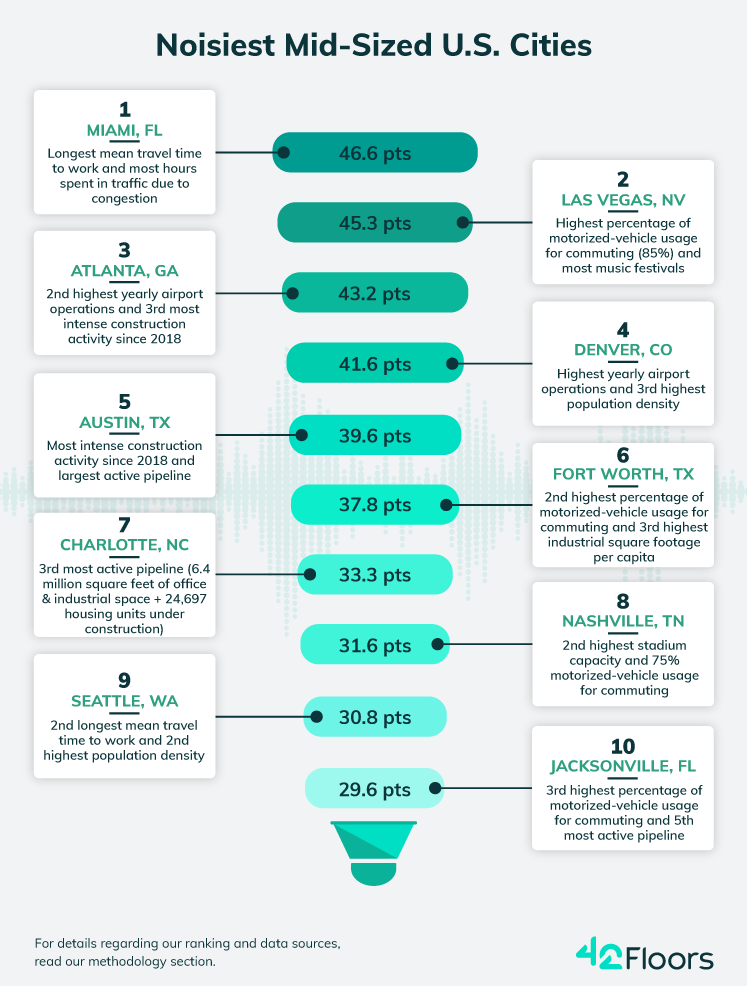
Miami, FL

There are several important sources of noise pollution in and around Miami, and road congestion is chief among them. As such, residents spend an extra 60 hours per year in traffic — three times more than those living in another Florida city that made the noisy city list, Jacksonville, Fla. In Miami’s case, the additional strain of having the longest average commute time in the ranking (26.4 minutes) is also likely to increase instances in which drivers vent their traffic frustrations in sonorous ways.
The most densely populated mid-sized city, Miami accommodates roughly 12,221 individuals per square mile — almost 3,500 more than Seattle in second place. In fact, the city even has a higher density than some of the more compact and populous urban centers, such as Chicago or Philadelphia.
As you might expect, Miami’s busy skies further drive up the decibels: Here, there are 844,958 airport landings and take-offs per year — the third-highest among mid-sized cities.
Las Vegas, NV

Las Vegans love their motorized vehicles, and roughly 85% of them use them to get around — the highest percentage across the ranking. Of course, that’s not exactly surprising in a city that hosted the Loop (a reimagining of the subway as an individual vehicle-based tunnel system).
Furthermore, Las Vegas also had the lowest percentage of workers who worked from home or remotely (14%). Even so, they still spent less time in traffic congestion than residents from other cities on the list to rank eighth with 30 extra hours annually.
Finally, its reputation as Sin City (and, similarly, the number of music festivals and various entertainment establishments) also play an important role in Las Vegas’ soundscape. The city ranked first for both metrics.
Atlanta, GA
 The home of the third most intense construction activity among mid-sized cities, Atlanta office space inventory grew by 13 million square feet since 2018. The city’s inventory also added roughly 7 million square feet of industrial space and 32,000 housing units in the same period.
Additionally, the airports servicing the city are some of the busiest in the world, totaling nearly 1 million landings and take-offs per year (the second-highest value within the ranking). Clearly, such high traffic volumes create plenty of acoustic discomfort for residents and businesses nearby.
Plus, since the start of the millennium, the city’s urban land area has repeatedly expanded by double-digit percentages. And, that level of sprawl has had a negative effect on the amount of time residents have to spend behind the wheel to get around: According to the most recent data, Atlantans lose 52 hours annually in traffic congestions — the second-highest amount among mid-sized cities on our list.
Denver, CO

Denver’s airports were the largest noise contributor in the Mile High City, with approximately 1.2 million landings and take-offs taking place each year. For context, that’s more air traffic than even significantly larger cities — such as New York, Houston, Chicago or Los Angeles — have to contend with.
However, traffic on land isn’t much easier on residents’ ears: 63% of Denverites who use a motorized vehicle to commute are spending 51 additional hours on the road due to congestion, which was the third-longest time for mid-sized cities.
And, following sustained real estate development in the last few years, Denver is also seeing more mixed-use areas. As a result, homes in the vicinity of commercial or industrial properties have to manage increased phonic interference. For this reason, Denver’s Department of Public Health & Environment kicked off the year with a decision to revise the city code to mitigate the effects of increased noise pollution.
Austin, TX

Sustained commercial and residential development in recent years has had an immense effect on noise pollution in Austin. Namely, the office market in Austin expanded by roughly 16 million square feet and the residential side grew by 41,740 units, both of which were the largest increases in their respective categorizes among mid-sized cities in our ranking.
Even so, there’s still plenty left in the city’s pipeline: According to CommercialEdge data, most commercial and residential projects currently under construction (by square feet and number of units) in cities with less than 1 million residents are located in Austin.
Very much in love with music, Austin is also home to crowd-drawing festivals and events, such as SXSW, Austin City Limits and the Austin Area Jazz Festival. Perhaps unsurprisingly, Austin tied for first with Las Vegas for this metric.
Fort Worth, TX
 With the second-lowest percentage of residents working from home (15%), as well as the second-highest share of commuters who use a motorized vehicle to get around (84%), it’s clear that traffic plays a big part in Fort Worth’s overall noise levels.
At the same time, the city also recorded the third-longest travel time to work among mid-sized cities, with the average one-way trip being roughly 26 minutes long.
Finally, as a result of ongoing industrial development in the local market (with 12.6 million square feet currently under construction and double that amount added to its inventory between 2018 and 2022), Fort Worth also ranked third for industrial square feet built per capita.
Charlotte, NC

Charlotte’s place among the noisiest mid-sized cities was largely tied to the scale and location of construction activity in the area.
Charlotte is on an ascendent path and its uptown is becoming an important area for developers and investors. Plus, the city ranked fourth for the amount of housing units, as well as industrial and office square feet that were added to its inventory during the last five years. It also landed in third for its current pipeline, which includes 6.4 million square feet of office and industrial space and 24,697 new housing units.
Nashville, TN

Unfortunately for its residents, the main contributors to Music City’s noise levels are not of the melodious kind. Rather, as with most of the car-centric cities across the U.S., sounds produced by various vehicles stuck in traffic are an ever-present issue here as 75% of Nashville residents use cars, trucks, vans or motorcycles to commute. They also end up spending an extra 37 hours per year on the road due to traffic congestion.
Similarly, full stadiums during sporting or other events — especially given the increased seating capacity of Nashville’s arenas — further add to the city’s soundscape. Altogether, Nashville’s stadiums and indoor venues combine for a total of roughly 178,000 people, which was the second-highest capacity among mid-sized cities.
Seattle, WA

With the second-largest population density within the ranking, Seattle accommodates roughly 8,750 residents per square mile. (That’s nearly double the density of third-place Denver.) The city also ranked first for its stadiums’ “noise potential” with an aggregate capacity of 217,064 attendees.
Additionally, Seattle capped another couple of second-place finishes for its drinking and entertainment establishment density (roughly 32 per 100,000 residents), as well as its average travel time to work of 26.3 minutes.
Jacksonville, FL

The Florida city had the third-highest percentage of its residents commuting via a motorized vehicle (83%), coupled with the third-lowest share of people working from home (16%), making Jacksonville’s roads one of its main sources of noise pollution.
Going forward, construction activity within the local area is also likely to define the city’s soundscape for years to come, as Jacksonville has the fifth-largest pipeline on the list with more than 6.3 million square feet of industrial space and 9,219 housing units under construction.
Who Decides What Constitutes Noise Pollution?
What constitutes unnecessary or harmful levels of noise, as well as how to mitigate its effects on residents remains a complex and contentious issue. For instance, residents might put up with the inconvenience of living near a construction site if it will eventually alleviate the local housing shortage or deliver conveniently located job opportunities in the future. In the same way, large events held in densely inhabited downtowns can be distracting, but they also tend to be a seasonal occurrence, as opposed to the daily humdrum of road congestion.
Conversely, trying to deal with traffic by adding highway lanes can be a double-edged sword: Research shows that these measures generally lead to induced demand (prompting even more people to use their cars) and do little to nothing to bring down noise levels.
Meanwhile, the increased frequency of airport landings and take-offs happening above residential areas — aided by technologies such as the NextGen air traffic control system — is likely to have a disproportionate effect on residents living outside the city core. Furthermore, these are often the very same people who have already been displaced by gentrification.
In any case, as local communities try to negotiate a pace of development that doesn’t have adverse effects on their quality of life, they have a key role to play in decisions about which sources of sound pollution need to be addressed. In that respect, this study hopes to become one of the multitude of perspectives required to provide comprehensive and equitable solutions to these problems.
Methodology
This analysis is broken down into two separate rankings: the first part gauges the performances of U.S. cities with populations of 1 million residents or more, while the second part looks at urban areas with populations below the 1-million threshold.
Our ranking of the noisiest cities across both categories was based on 12 selected indexes, as defined below:
“Total airport operations” represents the number of operations (landings and takeoffs) for airports serving the city. Values scored were based on data gathered by the Federal Aviation Administration’s Operations Network (OPSNET). The maximum weight for this metric was 10 points.
“Noisy commute” is defined by the percentage of workers using motorized vehicles for their commute — car, truck, or van; public transportation; taxicab, motorcycle; or other means. The values scored were based on the U.S. Census Bureau’s 2021 American Community Survey data. The maximum weight for this metric was 10 points.
“Remote workers” represents the percentage of home-based professionals. The values scored were based on U.S. Census Bureau data. This metric is inversely proportional (the higher the percentage, the smaller the score). The maximum weight for this metric was 5 points.
“Mean travel time to work” is defined as average length of a one-way trip to work (measured in minutes). The values scored were based on the U.S. Census Bureau’s 2021 American Community Survey data. The maximum weight for this metric was 10 points.
“Yearly hours spent driving due to congestion” is based on 2022 traffic data from TomTom. The maximum weight for this metric was 10 points.
“Industrial square footage per capita” represents a city’s overall industrial inventory divided by its total population. The values scored were based on U.S. Census Bureau and CommercialEdge data. The maximum weight for this metric was 5 points.
“Construction activity” is a compound metric, ranking entries based on the total amount of housing units, as well as industrial and office space added to their respective inventories between 2018-2022. The values scored were based on CommercialEdge data, with points equally apportioned across all three use types. The maximum weight for this metric was 15 points.
“Under construction” is a compound metric that includes each city’s total square footage of office, industrial, as well as number of housing units currently in the pipeline. The values scored were based on 2023 CommercialEdge data, with points equally apportioned across all three use types. The maximum weight for this metric was 15 points.
“Music festivals” represents the total number of music events taking place within a city. The values scored were based on 2022 data gathered by Music Festival Wizard. The maximum weight for this metric was 5 points.
“Drinking establishments per 100,000 residents” represents the density of recreation establishments recorded under NAICS code 722410. This includes bars, taverns, nightclubs, or drinking places primarily engaged in preparing and serving alcoholic beverages for immediate consumption. Values scored were based off 2020 U.S. Census County Business Patterns numbers. The maximum weight for this metric was 5 points.
“Population density” represents the number of people in a square mile. Values scored were based off the U.S. Census Bureau’s 2021 American Community Survey data. The maximum weight for this metric was 5 points.
“Stadiums” represents the overall capacity of stadiums and indoor arenas within each city. Values scored were based off data centralized by Wikipedia. The maximum weight for this metric was 5 points.